BCG GenAI Job Simulation
Task 1
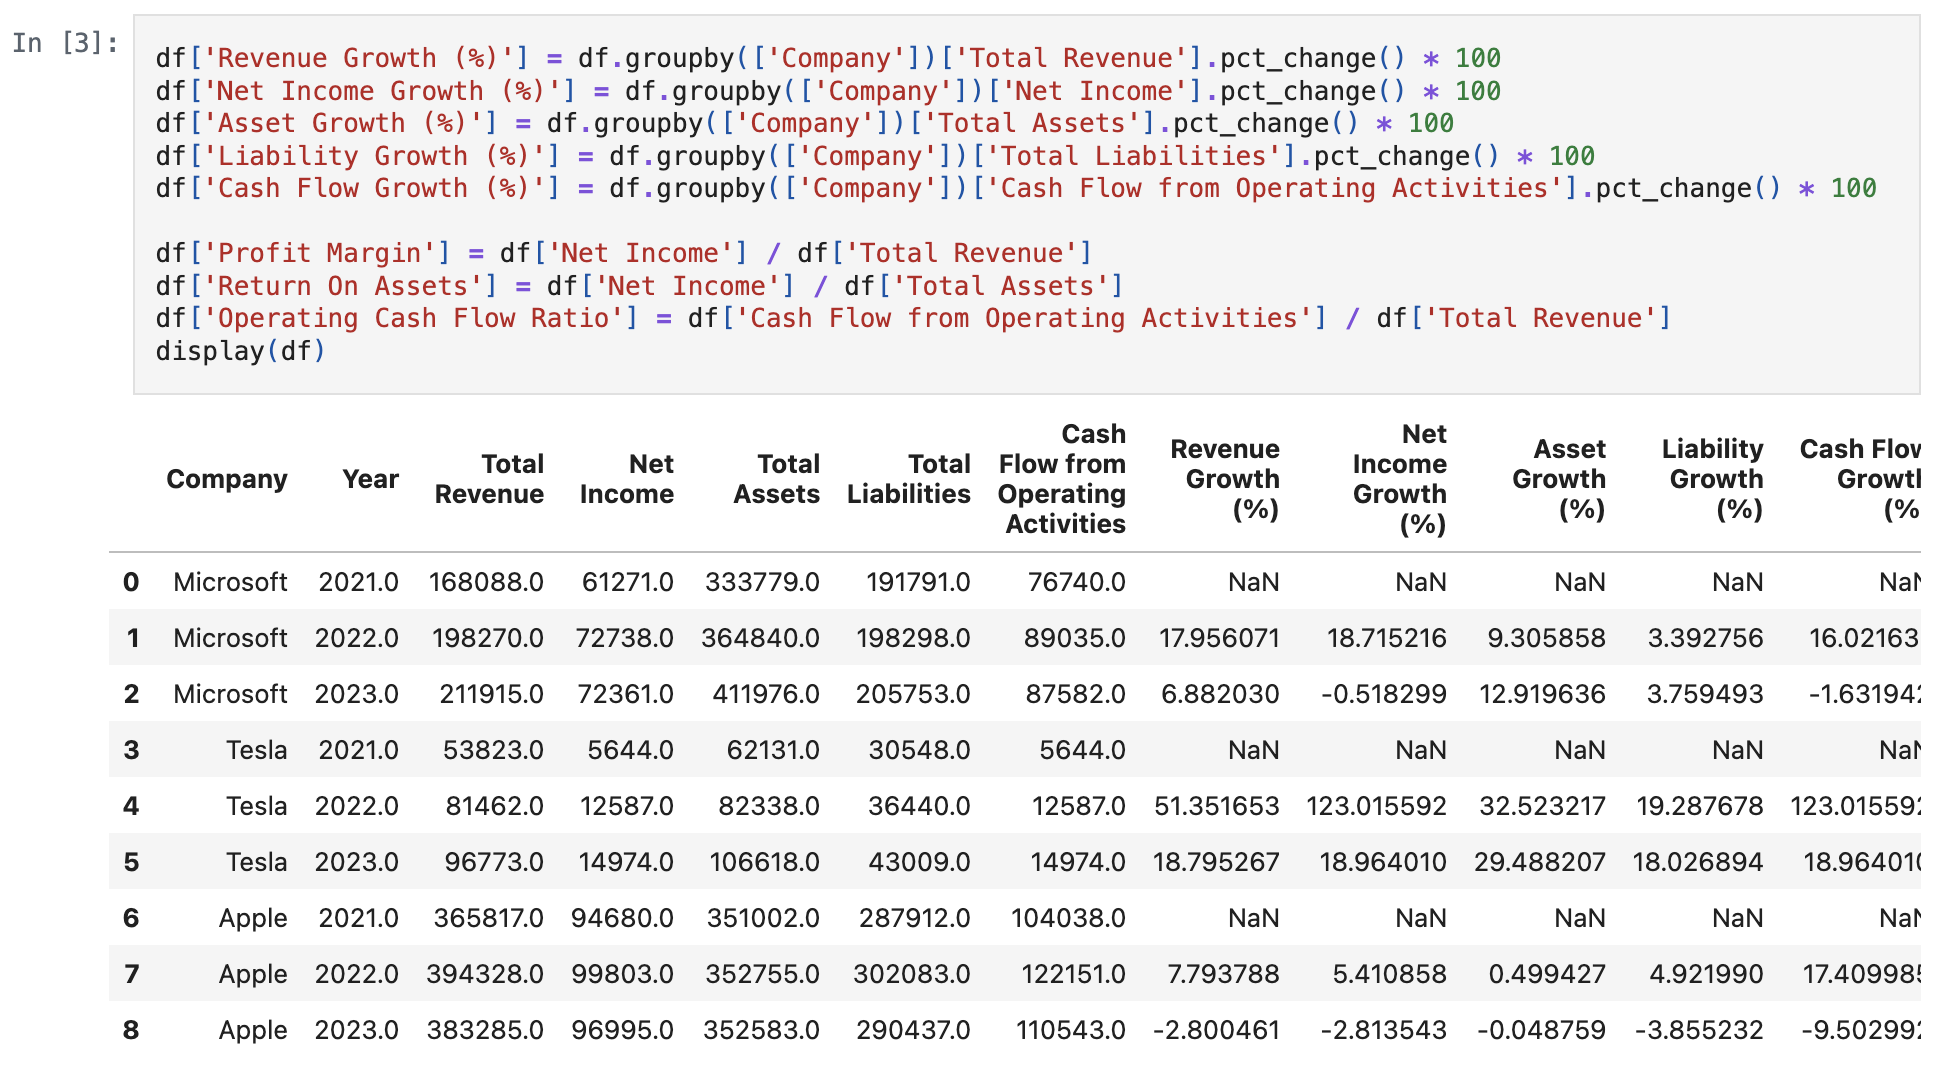
Extracted key financial data for the last three fiscal years from the 10-K and 10-Q reports of Microsoft, Tesla, and Apple.
- Growth columns created to analyse year-over-year changes in financial metrics.
- Profit margin as measure of profitability of business.
- \(\text{Profit Margin} = \frac{\text{Net Income}}{\text{Total Revenue}}\)
- Return on assets as measure of business asset utilisation.
- \(\text{Return on Assets} = \frac{\text{Net Income}}{\text{Total Assets}}\)
- Operating cash flow ratio as measure of operational efficiency.
- \(\text{Operating Cash Flow Ratio} = \frac{\text{Operating Cash Flow}}{\text{Total Revenue}}\)
- \(\text{Operating Cash Flow Ratio} = \frac{\text{Operating Cash Flow}}{\text{Total Revenue}}\)
Conducted exploratory data analysis by comparing boxplots of financial data metrics for each company grouped by year.
Conclusions:
- Given the growths and ratios of the provided metrics, Tesla consistently has the highest growth and the lowest cash flows among the given companies, implying potential sustainability issues and liquidity risks.
- Apple consistently demonstrates high cash flows, but low or even negative growths compared to the other companies, suggesting great financial stability along with lack of long-term potential.
- Microsoft often hits the middle ground in terms of cash flows and growths, along with often attaining relatively high metric ratios, which implies that it is relatively stable in terms of both the short term and the long term, though with likely lower returns than Apple or Tesla.
Task 2
- Applied rule-based logic for financial chatbot development to provide user-friendly financial insights and analysis.
- Chatbot has 2 major queries it can respond to:
1: Insert company, year and property to find the corresponding value.2: Find the greatest/least value within each company or year.q: Exit the chatbot.
- The chatbot will consider any other input as invalid responses.
- It can only take very limited forms of input, which heavily restricts the types of queries it can answer.
```{python}
def companyinput():
    print("List of companies:")
    for x in df.Company.unique():
        print("* " + str(x))
    c1 = input("From above, input company of interest: ")
    while c1 not in df.Company.unique():
        c1 = input("Invalid input, try again:")
    return c1

def yearinput():
    print("List of years:")
    yearlist = [str(x) for x in df.Year.unique()]
    for x in yearlist:
        print("* " + str(x))
    y1 = input("From above, input year of interest: ")
    while y1 not in yearlist:
        y1 = input("Invalid input, try again:")
    return y1

def propertyinput():
    print("List of properties:")
    categorical = ["Company", "Year"]
    growths = ["Revenue Growth (%)", "Net Income Growth (%)", "Asset Growth (%)", "Liability Growth (%)", "Cash Flow Growth (%)"]
    propertylist = [x for x in list(df.columns) if x not in categorical]
    for x in propertylist:
        print("* " + str(x))
    p1 = input("From above, input property of interest: ")
    while p1 not in propertylist:
        p1 = input("Invalid input, try again:")
    return p1
```
```{python}
def chatbot_v2():
option = input('Enter option: \n1: Value of property given year and company \n2: Greatest/least value of property given year/company \nq: Quit \n')
while option not in ["1", "2", "q"]:
option = input("Invalid input, try again:")
if option == "1":
c1 = companyinput()
y1 = yearinput()
p1 = propertyinput()
try:
interestvals = df.loc[(df["Company"] == c1) & (df["Year"] == float(y1))][p1].values
interestvals = interestvals[~np.isnan(interestvals)]
interestval = interestvals[0]
print("Value of " + p1 + " for " + c1 + " in " + y1 + ": " + str(interestval))
except IndexError:
print("Value of " + p1 + " for " + c1 + " in " + y1 + " is not available in the dataset.")
elif option == "2":
updown = input("Greatest or Least? ")
while updown not in ["Greatest", "Least"]:
updown = input("Invalid input, try again:")
p1 = propertyinput()
compyear = input("Company or Year? ")
while compyear not in ["Company", "Year"]:
compyear = input("Invalid input, try again:")
if compyear == "Company":
cy2 = companyinput()
interestvals = df.loc[df["Company"] == cy2][p1]
interestvals = interestvals[~np.isnan(interestvals)]
if updown == "Greatest":
interestval = max(interestvals)
print("Maximum value of " + p1 + " for all years in " + cy2 + ": " + str(interestval))
else:
interestval = min(interestvals)
print("Minimum value of " + p1 + " for all years in " + cy2 + ": " + str(interestval))
else:
cy2 = yearinput()
interestvals = df.loc[df["Year"] == float(cy2)][p1].tolist()
# interestvals = interestvals[~np.isnan(interestvals)]
# print(interestvals)
if updown == "Greatest":
interestval = max(interestvals)
print("Maximum value of " + p1 + " for all companies in " + cy2 + ": " + str(interestval))
else:
interestval = min(interestvals)
print("Minimum value of " + p1 + " for all companies in " + cy2 + ": " + str(interestval))
else:
print("Good day.")
```